Percentage change from 3/6 close to 3/13 close and from 3/13 close to 3/20 close
(the yield changes are the percentage points differences,
e.g. for the 2-Y Treasury, it went from 3.72% to 3.91%. a change of +0.19%)
3/6 to 3/13 to
3/13 3/20
------ ------
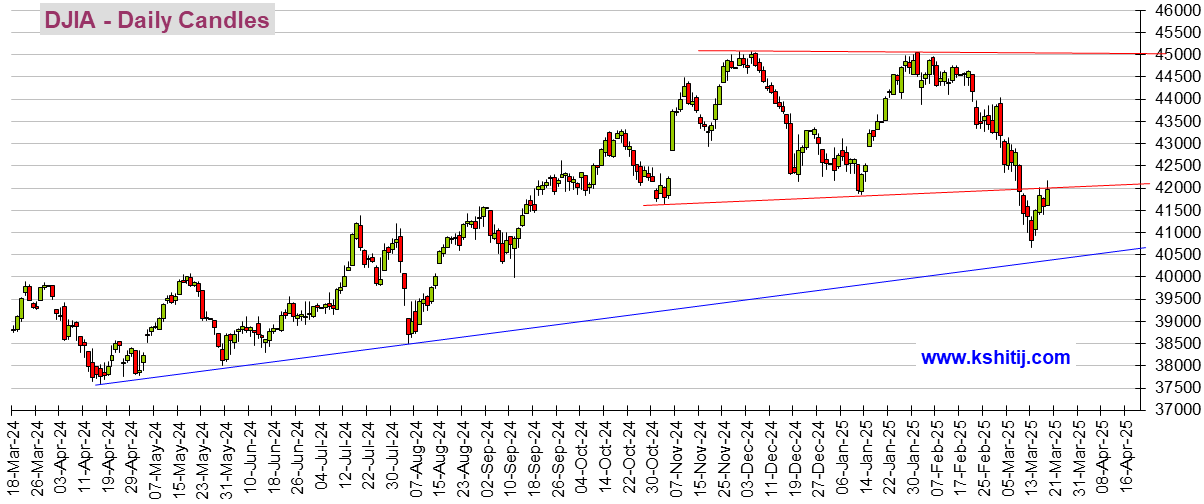
-1.99% -2.11% Dow
-1.60% -1.90% S&P 500
-1.26% -2.07% NASDAQ
+0.16% +0.19% 2-Yr Treas
+0.13% +0.15% 5-Yr Treas
+0.15% +0.11% 10-Yr Treas
-3.05% -10.57% Gold
-5.41% -15.22% Silver
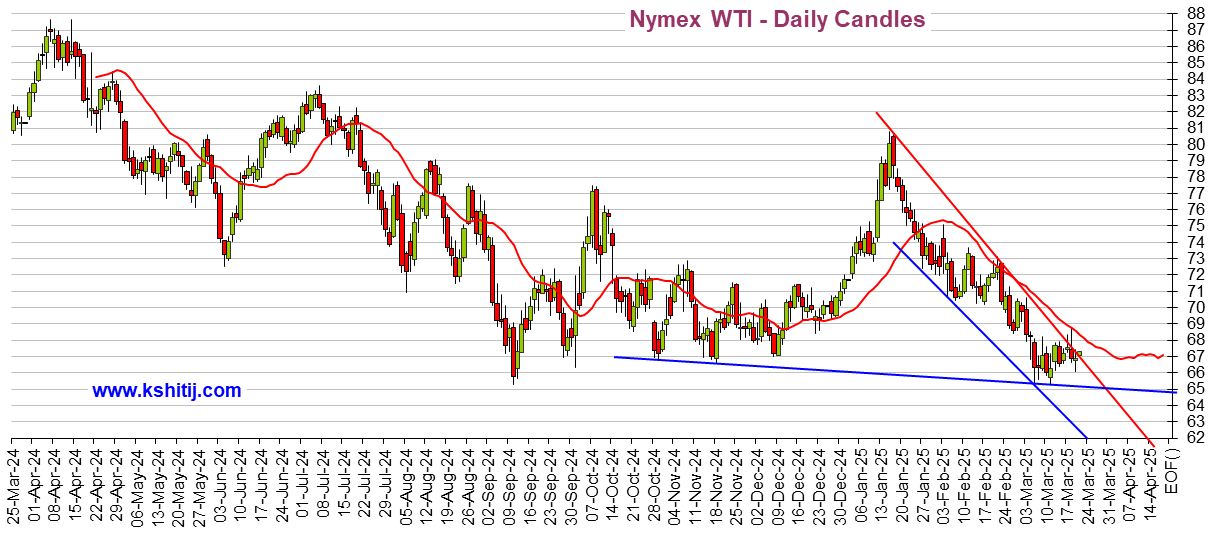
+8.80% -0.49% WTI
Treasury notes' yields up means the notes' values are down
as likely people's bond portfolios
Yikes on the yield changes! The 30 year mortgage rate is strongly correlated with the 10 year Treasury.
For a 6- to 9-month perspective, depending on which graph, I like pasting these in because the automatically update. I wish I had one for the S&P 500, but I don't, oh well.
Dow, Oil, and Dollar (last several months) - they update a few hours (like about 6 hours) after the close
The attacks on Iran began on February 28.
Dow 30,
Crude Oil
US Dollar Index (DX-Y.NYB)
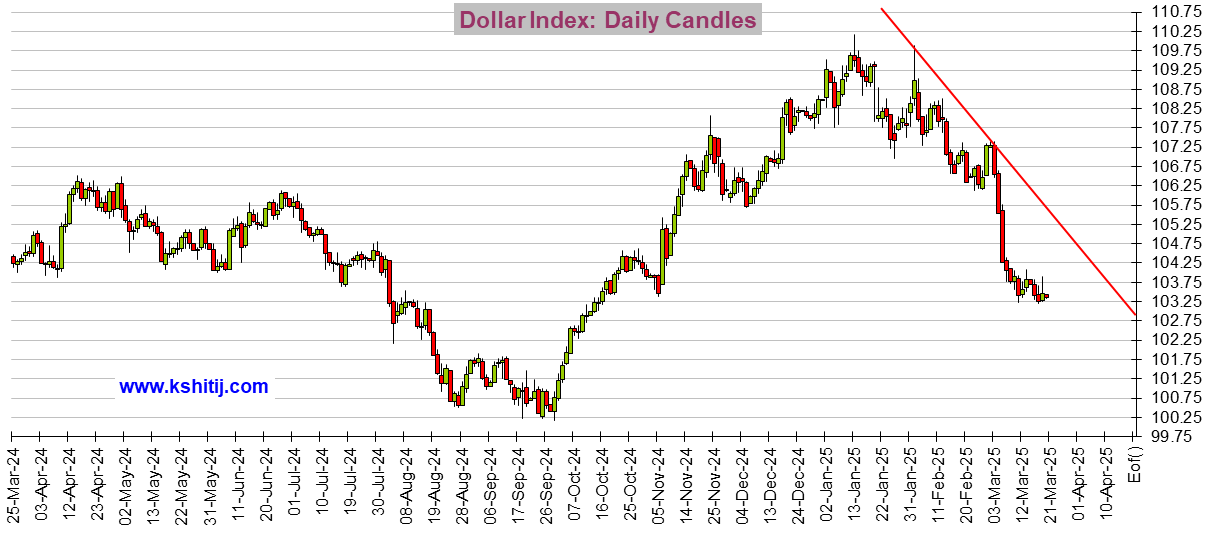
The graphs above update automatically. So they are up-to-date a few hours after each close.
There should be 3 graphs above. If you see little image squares and no graphs, right click on each such image square and choose Load Image.
=============================
Good additions might be the dollar index, and an international stock index like the MSCI ACWI ex U.S.
I watch Bitcoin too, even though I consider it immoral and crap as an investment long-term.

 = new reply since forum marked as read